The Theory of Fetal Programming
During critical development periods, an embryo or fetus lacking essential nutrients or oxygen or exposed to harmful substances such as tobacco or alcohol may be forced to alter its normal development process in order to survive. These adaptations may result in permanently altering the structure and function of some fetal organs, which may increase the risk of certain diseases later in life. "Fetal programming" is the phrase often used to describe permanent changes resulting from the prenatal environment.1
For example, when a fetus is lacking oxygen, the brain and heart receive oxygen at the expense of other organs such as the liver, pancreas, and kidneys. As a result, these organs may not grow to normal size or achieve normal function.
Plausibility
 The link between prenatal health and lifelong health can be more easily understood by considering that most cell generations appear before birth while most cells appear after birth. The graph below shows the relationship between the number of cells in the human body, and the number of cell generations at several milestones in the human life cycle. The term "cell generations" refers to the process where one cell divides into two, two into four, and so on. Each division represents one cell generation. The number of cell generations is shown along the horizontal axis while the number of cells is shown along the vertical axis.
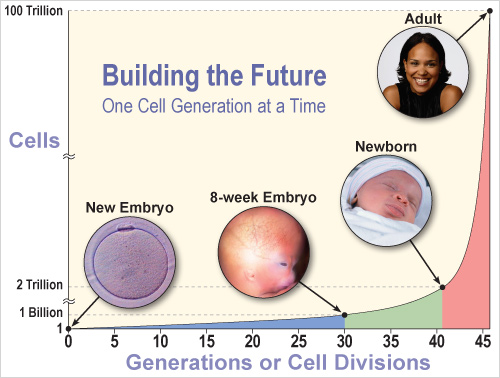
We know that fertilization produces a single-cell embryo prior to the onset of cell division. This explains the first point on the graph (one cell, zero divisions). The number of cells in an adult is estimated to be between 30 trillion and 100 trillion.2 To reach these large numbers from a single cell, 46 to 47 generations of cells, to a first approximation, are required.3 This explains the last milestone on the graph.
The second milestone in the human life cycle shown on the graph occurs after thirty generations of cell divisions when approximately one billion cells are present. You may be surprised to learn that this occurs at the end of the embryonic period, just 8 weeks after fertilization.
The third milestone on the graph is shown following 41 generations, which coincides approximately with birth4 when an estimated two trillion cells are present.5
This graph illustrates that most cell generations appear before birth while most cells appear after birth. Therefore, it is perfectly reasonable to think that the quality of the prenatal environment in which the first 41 generations of cells develop before birth will influence the health of all the cells that develop after birth.
Footnotes
| 1 | Barker DJ, Clark PM, 1997. 105. |
| 2 | Lodish et al., 2000. 12; Guyton and Hall, 2000. 2. |
| 3 | See Appendix A. |
| 4 | Pringle, 1988. 176. |
| 5 | See Appendix A. |
Bibliography
Pringle KC. 1988. A reassessment of pregnancy staging. Fetal Ther. 3(3):173-184.
Search EHD Ref. / Abstract
Barker DJ, Clark PM. 1997. Fetal undernutrition and disease in later life. Rev Reprod. May;2(2):105-12.
Search EHD Ref. / Abstract Full Text
Guyton AC, Hall JE. 2000. Textbook of medical physiology. 10th ed. Philadelphia: W.B. Saunders.
Search EHD
Lodish H, Berk A, Zipursky SL, Matsudaira P, Baltimore D, Darnell J. 2000. Molecular cell biology. 4th ed. New York: W.H. Freeman.
Search EHD